Visualization Type Selection in SurveyJS Dashboard
Visualization type selection is an interactive feature that allows users to switch between different visualization types (charts, tables, and others) for each dashboard item using a dropdown menu.
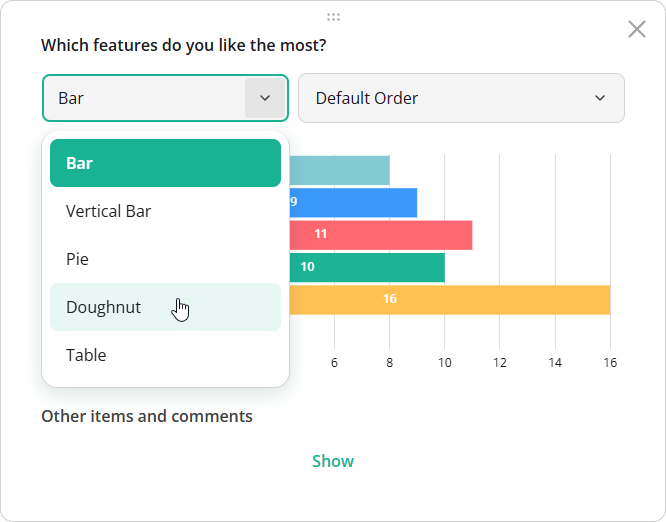
Supported Visualization Types
Visualization type selection is available for all types except Response Count.
Enable or Disable Visualization Type Selection
Visualization type selection is enabled by default. To disable it for the entire dashboard, set the allowChangeVisualizerType property to false when creating a Dashboard instance:
import { Dashboard } from "survey-analytics";

const dashboard = new Dashboard({
  questions: [ /* Survey questions to visualize */ ],
  data: [ /* Survey responses to aggregate */ ],
  items: [ /* Dashboard item configurations */ ],
  allowChangeVisualizerType: false // Disables visualization type selection globally
});
To override this setting for a specific dashboard item, set its allowChangeType property. Item-level settings take precedence over the global configuration.
import { Dashboard } from "survey-analytics";

const dashboard = new Dashboard({
  questions: [ /* ... */ ],
  data: [ /* ... */ ],
  allowChangeVisualizerType: false, // Disable globally
  items: [
    {
      name: "question1",
      allowChangeType: true // Re-enable for this item
    },
    // ...
  ]
});
Change Visualization Type Programmatically
To define visualization types in code, set the type property when configuring dashboard items:
import { Dashboard } from "survey-analytics";

const dashboard = new Dashboard({
  questions: [ /* Survey questions to visualize */ ],
  data: [ /* Survey responses to aggregate */ ],
  items: [
    {
      name: "question1",
      type: "bar"
    },
    {
      name: "question2",
      type: "pie"
    },
    {
      name: "question3",
      type: "nps"
    }
  ]
});
You can also change the visualization type at runtime. The target type must be included in the availableTypes array for the item. This means it should either be enabled by default (when items are auto-generated) or explicitly listed in availableTypes (when you configure dashboard items manually).
import { Dashboard } from "survey-analytics";

const dashboard = new Dashboard({
  /* Dashboard configuration */
});

dashboard.getItem("question1").type = "doughnut";
Restrict Available Types
Use the availableTypes array to control which visualization types users can select:
import { Dashboard } from "survey-analytics";

const dashboard = new Dashboard({
  questions: [ /* Survey questions to visualize */ ],
  data: [ /* Survey responses to aggregate */ ],
  items: [
    {
      name: "question1",
      type: "vbar",
      availableTypes: [ "vbar", "pie" ]
    },
    // ...
  ]
});
Other Interactive UI Features
Send feedback to the SurveyJS team
Need help? Visit our support page