Reporting and analytics
Does SurveyJS support survey data analytics?
Yes. SurveyJS offers a dedicated Dashboard component that lets you visualize and analyze survey results in real time. The Dashboard works with the survey schema (JSON configuration) created in Survey Creator to determine how to visualize different question types. It then populates charts and tables with the responses collected through the Form Library. With SurveyJS Dashboard, you can: To get started, simply select your framework and follow our Get Started guide. You can also explore our interactive Dashboard demos.
Can I export survey responses to Excel or CSV?
Yes. SurveyJS returns responses in JSON format, which you can send to your backend and store in a database. From there, you can easily export the stored results to CSV or Excel using your server-side tools or libraries like json2csv (for CSV) or exceljs (for Excel). If you prefer, you can also implement client-side export directly in the browser for smaller datasets. As an alternative, you can use the SurveyJS Dashboard. It comes with a built-in Table View component that displays collected survey responses in a data grid. The grid can be configured to load data directly from your backend and supports sorting, filtering, and pagination—either client-side or server-side depending on your setup. Once responses are displayed in the Table View, users can export them to CSV, Excel, or PDF. Please refer to this Table View Dashboard demo to learn more.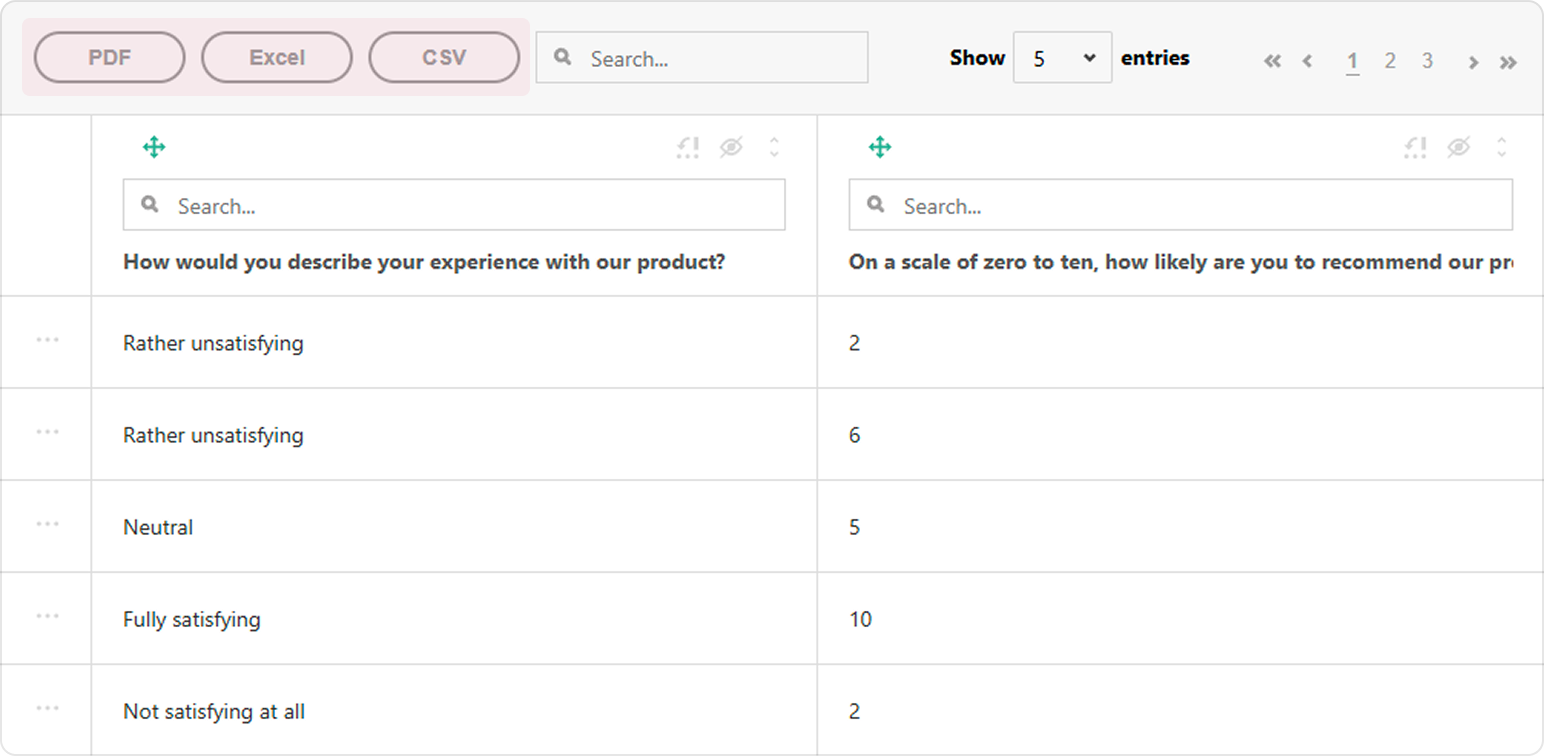
Send feedback to the SurveyJS team
Need help? Visit our support page